

Candlestick chart pattern is graphical presentations of price information of securities over time. Charts plot historical data based on a combination of price, volume as well as a time interval.
Here we talk about the Japanese Single & Double Candlestick Chart pattern.
TOPICS TO COVER
- Single candle pattern
- MARUBOZU
- HAMMER
- HANGING MAN
- INVERTED HAMMER
- SHOOTING STAR
- DOJI
- DOUBLE CANDLE PATTER
- HARAMI
- PIERCING PATTERN
- DARK CLOUD COVER
SINGLE CANDLESTICK CHART PATTERN
Single candle pattern forms based on single time frame trading action. As the name suggests, this type of candlestick pattern is made of a single candle.
Types of Single Candlestick Pattern—–
MARUBOZU
This type of candles have no upper or lower shadow.

BULLISH MARUBOZU
STRUCTURE
This single candlestick chart pattern has a green body with no upper or lower shadow.
CHARACTERISTICS
i) It has bullish Bias and can form anywhere in an uptrend or downtrend. Represents a rapid increase in trading activity.
ii) It is a continuation single candle chart pattern.
HOW TO TRADE
Enter with a long position in the market when bullish Marubozu happens. Place the stop loss just below the opening (low) of the candle. Keep your target open. Book profit After 2-5% profit.
BEARISH MARUBOZU
STRUCTURE
This single candlestick chart pattern has red body with no upper of lower shadow.


CHARACTERISTICS
i) It has bearish Bias and can form anywhere in an uptrend or downtrend. Represents a rapid decrease in trading activity.
ii) It is a continuation single candle chart pattern.
HOW TO TRADE
Enter with a short position in the market when Bearish Marubozu happens. Place the stop loss just above the opening (high) of the candle. Keep your target open. Book profit After 2-5% profit.
HAMMER CANDLESTICK CHART PATTERN
STRUCTURE

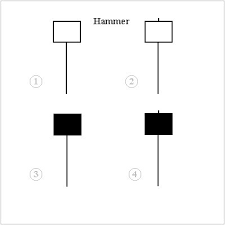
i) This single candlestick chart pattern has either a red body or a green body.
Ii) The body of the candle is small represents the small difference between opening and closing.
iii) Hammer has a lower shadow (wick) which is at least two times or more longer than the body of the hammer.
iv) Hammer has a very small or no upper shadow.
CHARACTERISTICS
i) It is a bullish reversal single candlestick pattern.
ii) It generally occurs after a downtrend.
iii) Hammer and hanging man has the same appearance, but the hammer is bullish and hanging is bearish.
CONFIRMATION
Wait for a candle close above the hammer candle for confirmation to avoid a false breakout.
HOW TO TRADE
Enter with a long position in the market when Hammer happens. Place the stop loss just below the opening (low) of the candle. Keep your target open. Book profit After 2-5% profit.

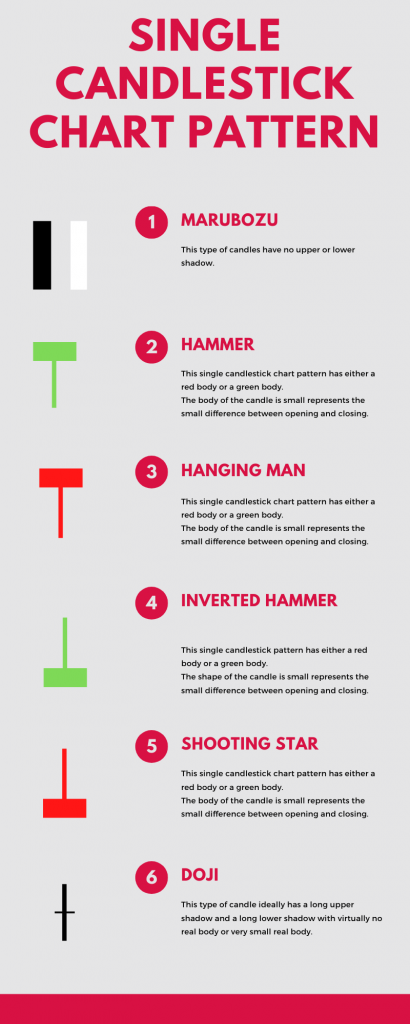
HANGING MAN

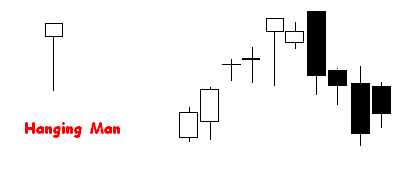
STRUCTURE
i) This single candlestick chart pattern has either a red body or a green body.
Ii) The body of the candle is small represents the small difference between opening and closing.
iii) Hanging man has a lower shadow (wick) which is at least two times or more longer than the body of the Hanging Man.
iv) Hanging man has a very small or no upper shadow.
CHARACTERISTICS
i) It is a bearish reversal single candlestick pattern.
ii) It generally occurs after a uptrend.
iii) Hammer and hanging man has the same appearance, but the hammer is bullish and hanging is bearish.
CONFIRMATION
Wait for a candle close below the hanging man candle for confirmation to avoid false breakout.
HOW TO TRADE
Enter with a short position in the market when Hanging man happens. Place the stop loss just above the opening (high) of the candle. Keep your target open. Book profit After 2-5% profit.
INVERTED HAMMER CANDLESTICK CHART PATTERN

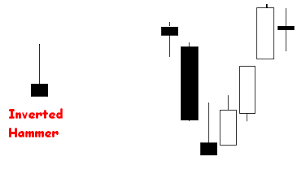
STRUCTURE
i) This single candlestick pattern has either a red body or a green body.
Ii) The shape of the candle is small represents the small difference between opening and closing.
iii) Inverted Hammer has an overhead shadow (wick) which is at least two times or more longer than the body of the Inverted hammer.
iv) Inverted Hammer has a very small or no lower shadow.
CHARACTERISTICS
i) It is a bullish reversal single candlestick pattern.
ii) It generally occurs after a downtrend.
iii) Hammer and inverted hammer both can form after a downtrend and both indicate the potential reversal of the downtrend. Hammer and Inverted hammer both are bullish reversal pattern. But, the hammer is slightly more bullish (sentiment) than an inverted hammer.
CONFIRMATION
Wait for a candle close upward the Inverted hammer candle for confirmation to avoid false breakout.
HOW TO TRADE
Enter with a long position in the market while an Inverted Hammer happens. Place the stop loss just below the lower shadow of the candle. Put your target open. Book profit After 2-5% profit.
SHOOTING STAR

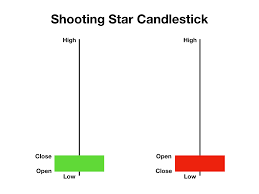
STRUCTURE
i) This single candlestick chart pattern has either a red body or a green body.
Ii) The body of the candle is small represents the small difference between opening and closing.
iii) Shooting Star has an upper shadow (wick) which is at least two times or more longer than the body of the Shooting Star.
iv) Shooting Star has a very small or no lower shadow.
CHARACTERISTICS
i) It is a Bearish reversal single candlestick pattern.
ii) It generally occurs after a uptrend.
iii) Hanging man and Shooting Star both can form after an uptrend and both indicate the potential reversal of the uptrend.
Hanging man and Shooting Star both are bearish reversal pattern. But, shooting star is slightly more bearish (sentiment) than Hanging Man.
CONFIRMATION
Wait for a candle close below the shooting Star candle for confirmation to avoid false breakout.
HOW TO TRADE
Enter with a short position in the market when Hanging man happens. Place the stop loss just above the opening (high) of the candle. Keep your target open. Book profit After 2-5% profit.
DOJI CANDLESTICK CHART PATTERN
Doji represents indecision.

STRUCTURE
This type of candle ideally has a long upper shadow and a long lower shadow with virtually no real body or very small real body.
CHARACTER
i) No real body (or very little real body) represents price close exactly where price open.
ii)Long upper or lower shadow represents hard battle between bulls and bears.
iii) At last closing price at or very near the opening price symbolizes indecision of the market and a potential trend reversal can happen.
iv) It is bullish reversal candlestick pattern when forms in a downtrend.
v) It bearish if formed in an uptrend.
vi) Sidewise trend already represents indecision in the market. Hence, it is irrelevant in a sidewise trend.
CONFIRMATION
If formed after an uptrend— Close of a candle below the lower wick of doji.
If formed after a downtrend— Close of a candle above the upper wick of doji.
HOW TO TRADE
If formed after an uptrend—
Enter with a short position in the market when Doji formed in an uptrend. Place the stop loss just above the high of the candle. Keep your target open. Book profit After 2-5% profit.
If formed after a downtrend— Enter with a long position in the market when Doji occurs in a downtrend. Place the stop loss just below the lower shadow of the candle. Keep your target open. Book profit After 2-5% profit.
DOUBLE CANDLESTICK CHART PATTERN
Double candlestick pattern forms based on double time frame trading action. As the name suggests, this type of candlestick pattern is made of a single candle.
Types of Double Candlestick Chart Patter—-
HARAMI
Harami represents indecision.
BULLISH HARAMI
STRUCTURE

i) It formed with One large red candle (1st)and one small green candle (2nd).
Ii) The body of the later green candle totally engulfed by the previous red candle.
CHARACTERISTICS
i) It formed in the end if a downtrend.
Ii) The previous red candle represents continuation of the down trend.
iii) The later small green candle represents the bear losing control of the market with the momentum of the downtrend reducing.
CONFIRMATION
Wait for a candle to close above the level of earlier red candle.
HOW TO TRADE
Enter with a long position in the market when Bullish harami happens. Place the stop loss just below the lower level of the earlier red candle. Keep your target open. Book profit After 2-5% profit.
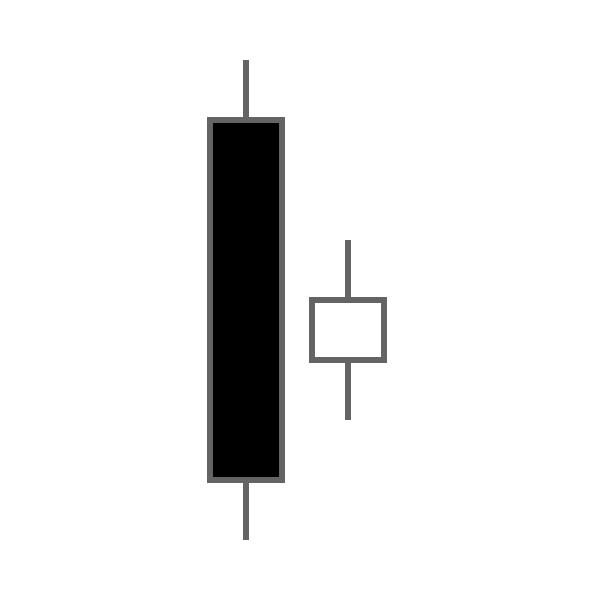
BEARISH HARAMI

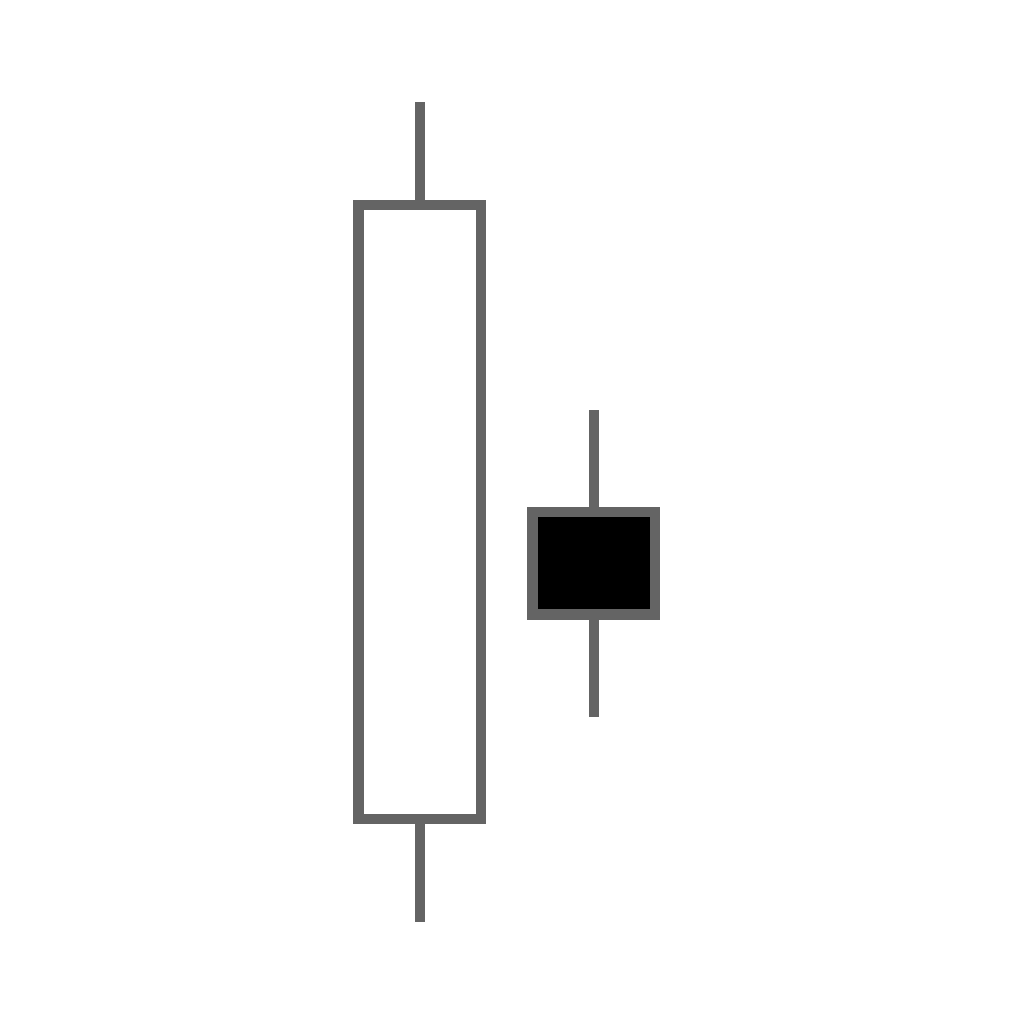
STRUCTURE
i) It formed with One large green candle (1st)and one small red candle (2nd).
Ii) The body of the later red candle totally engulfed by the previous green candle.
CHARACTERISTICS
i) It formed in the end if a uptrend.
Ii) The previous green candle represents continuation of the uptrend.
iii) The later small red candle represents the bulls losing control of the market with momentum of the uptrend reducing.
CONFIRMATION
Wait for a candle to close below the level of earlier green candle.
HOW TO TRADE
Enter with a short position in the market when bearish harami happens. Place the stop loss just above the upper level of the earlier green candle. Keep your target open. Book profit After 2-5% profit.
PIERCING PATTERN
STRUCTURE

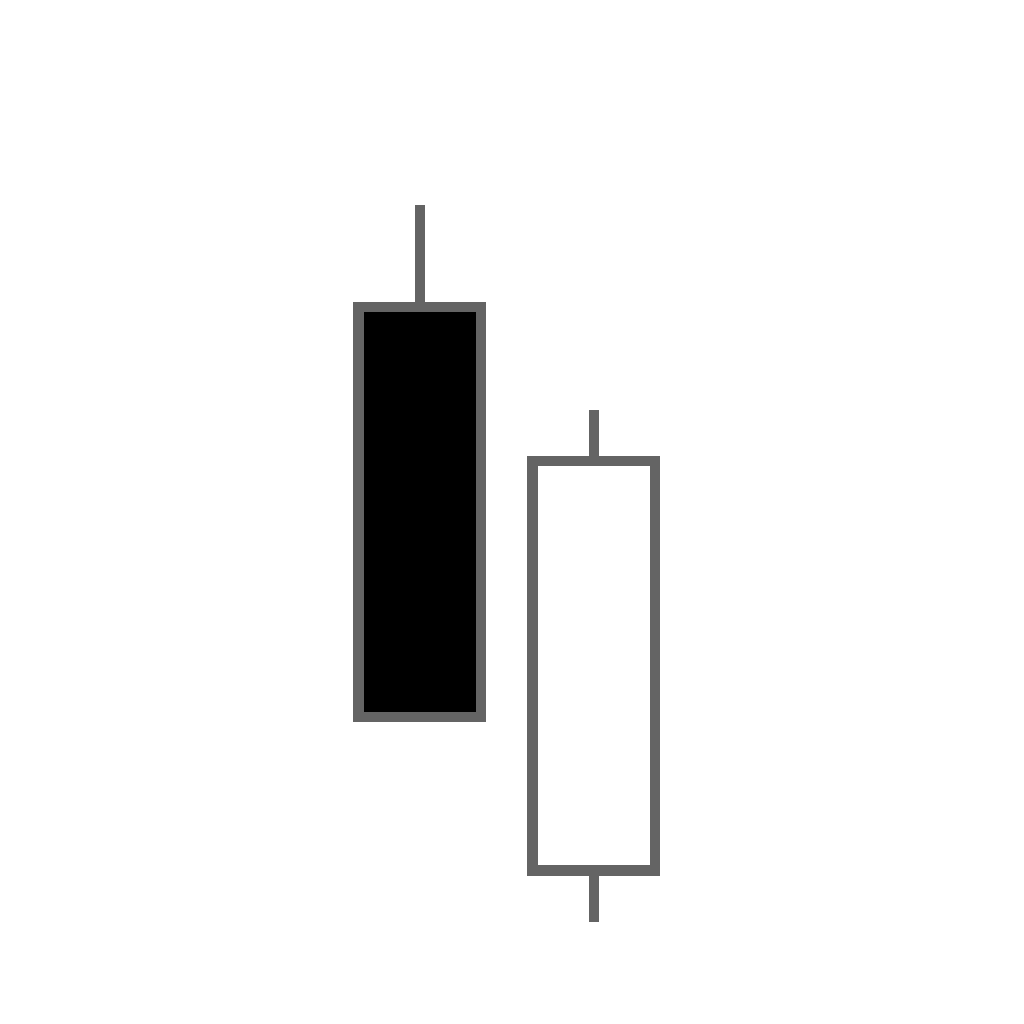
It formed with One large red candle (1st)and one green candle (2nd) which open the gap down and close at least above the half of the previous red candle.
CHARACTERISTICS
i) It formed in the end if a downtrend.
Ii) The previous red candle represents continuation of the down trend.
iii) The later green candle represents the bear losing control of the market, with bulls taking control.
CONFIRMATION
Wait for a candle to close above the higher level of earlier red candle.
HOW TO TRADE
Enter with a long position in the market when the Piercing pattern happens. Place the stop loss just below the lower level of the latter green candle. Keep your target open. Book profit After 2-5% profit.
DARK CLOUD COVER CANDLESTICK CHART PATTERN

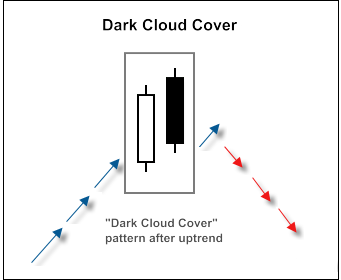
STRUCTURE
It formed with One large green candle (1st)and one red candle (2nd) which open gap up and close at least below the half of the previous green candle.
CHARACTERISTICS
i) It formed in the end if a uptrend.
Ii) The previous green candle represents continuation of the uptrend.
iii) The later red candle represents the bulls loosing control of the market, with bears taking control.
CONFIRMATION
Wait for a candle to close below the lower level of earlier green candle.
HOW TO TRADE
Enter with a long position in the market when the Dark cloud cover pattern happens. Place the stop loss just above the upper level of the latter red candle. Keep your target open. Book profit After 2-5% profit.
These are some basic single and multi candlestick chart patterns. There are some more candlestick chart patterns. They are–Morning star, Evening star, Bullish engulfing pattern, Bearish engulfing pattern, etc.
ALSO READ:
1. HOW TO USE INDICATOR IN TECHNICAL ANALYSIS
2. HOW TO TRADE HEAD AND SHOULDER CHART PATTERN


