
Head and shoulder chart pattern is a reversal chart pattern. They are easy to identify. They can be formed either in a bullish or bearish trend.
TOPICS TO COVER
- Bearish Reversal pattern
- Head and Shoulder Pattern
- Bearish Expanding Triangle Pattern
- Bullish reversal pattern
- Revers head and shoulder
- Bullish Expanding triangle pattern
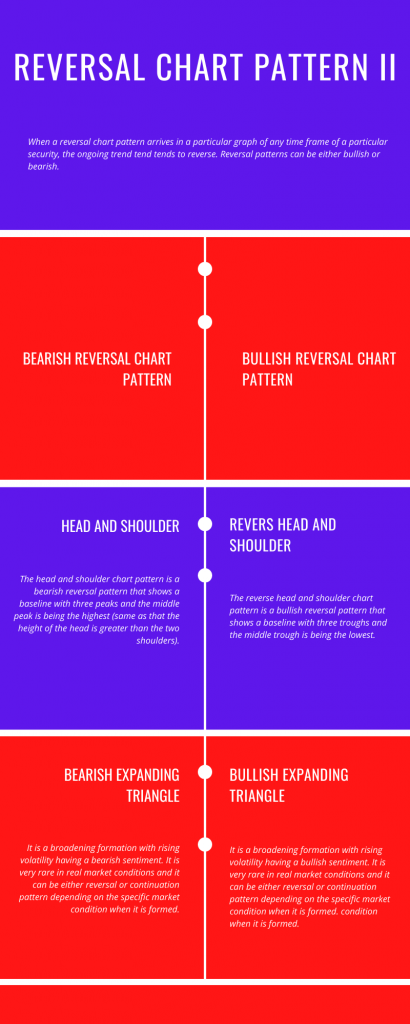
1. BEARISH REVERSAL CHART PATTERN
HEAD AND SHOULDER CHART PATTERN
DEFINITION
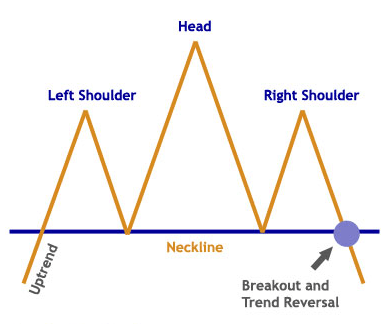
The head and shoulder chart pattern is a bearish reversal pattern that shows a baseline with three peaks and the middle peak is being the highest (same as that the height of the head is greater than the two shoulders).
The formation is rarely perfect and some noise always present between the respective shoulders and head.
HOW TO RECOGNIZE
(i) Left Shoulder: Price rise due to an ongoing uptrend followed by a peak (short-lived) and after that a minor (10-20%) retracement occurs and price decline to the baseline forming a trough.
(ii) Head: Price rise from the baseline (trough) and suppressing the previous high and form the highest peak. Then the price drops again to the baseline forming the second trough.
(iii)Right shoulder: Price rise again to the level near to the left shoulder forming the right shoulder. It is seen in an uptrend. It appears in all time frames and thus, can be applied to all kinds of trade and investing.
FEATURES AND LIMITATION
(i) The base line connecting the lowest point of the two-trough known as “neckline”.
(ii) The left and right shoulder also forms peak but don’t exceeds the height of the head.
(iii) You should wait until the price breaks the neckline for confirmation.
HOW TO TRADE
You should put the entry order just below the neckline. Because when the price breaks the neckline (support), it clearly indicates that the bears are in control. Place the stop loss just above the right shoulder. You should subtract the height of the head from the level of the neckline to provide a price target to the downside.
ALSO READ: Head And Shoulders Pattern
BEARISH EXPANDING TRIANGLE
DEFINITION
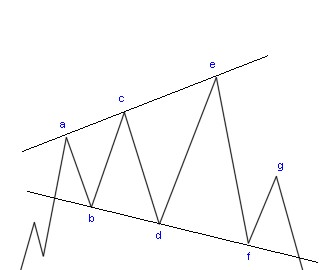
It is a broadening formation with rising volatility having a bearish sentiment. It is very rare in real market conditions and it can be either reversal or continuation pattern depending on the specific market condition when it is formed.
This pattern is a bearish reversal chart pattern if it forms at the end of an uptrend. Then it represents a potential trend reversal and you can expect a downtrend.
But it will be a continuation pattern if you identify it in a downtrend. Then it just simply a continuation of the trend.
HOW TO RECOGNIZE
Bearish Expanding Triangle pattern develops in 3 Phases:
1. Background (Prior trend):
- There always a prior trend Before occurring a chart pattern.
- It can be formed either after an uptrend or in a downtrend.
2. Consolidation of Price:
- The price of the security trade in a narrow zone as the pattern appears and price continues to make higher highs and lower lows making the trading range broader.
3. Break out of the lower support line: As the pattern develops the trading range broader and indicates the fight between bears and bulls. When price breaks the lower support line it indicates the win of bears.
FEATURES AND LIMITATION
- Vary in their duration. Can found in any time frames. But they are generally quite large.
- These patterns generally contain two swing highs and two lows.
- As the pattern develops the volume decline.
- It can be identified easily characterized by a series of higher highs and lower lows.
- The upper resistance line is sloping upward and the lower support line is slopping downward.
- As the pattern develops the trading zone expands.
- When the pattern starts the volatility is very low and price trades in a narrow zone and as the pattern develops the trading zone expands.
HOW TO TRADE
When price breaks the lower support line price tends to decline. So, enter the market with a sell order (short position).
Place your sell order just below the breakout of the lower support line. More defensive traders wait for a candle to close under the lower support line for confirmation. Whereas more aggressive traders place their orders when the price trade under the lower support line.
Place your stop loss tight and place it just above your entry.
Though there is no confirmed method to estimate your profit target in bearish expanding chart pattern, but for rough calculation expand the height of expanding portion of the triangle downward from your entry point.
ALSO READ: Bear Expanding Triangle
2. BULLISH REVERSAL CHART PATTERN
REVERS HEAD AND SHOULDER CHART PATTERN
DEFINITION
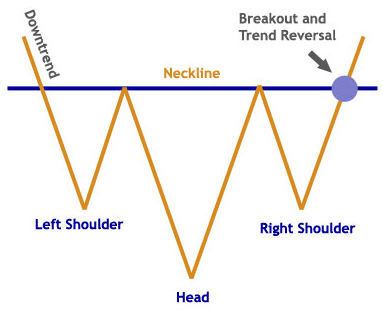
The reverse head and shoulder chart pattern is a bullish reversal pattern that shows a baseline with three troughs and the middle trough is being the lowest.
The formation are rarely perfect and some noise always present between the respective shoulders and head.
HOW TO RECOGNIZE
(i) Left Shoulder: Price falls due to an ongoing downtrend followed by new low (short-lived and left shoulder) and after that, a minor (10-20%) advancement occur and push price slightly higher.
(ii) Head: Price falls from the resistance level and falls below the previous low and form the lowest trough(head). Then the price rises again to the resistance level the same as the previous high.
(iii) Right shoulder: Price falls again to the level near to the left shoulder forming the right shoulder.
It is seen in a downtrend. It appears in all time frames and thus can be applied to all kinds of trade and investing.
FEATURES AND LIMITATION
(i) The resistance line connecting the higher point of the two-trough known as “neckline”.
(ii) The left and right shoulder also forms trough but don’t exceeds the deepness of the head.
(iii) You should wait until the price breaks the neckline for confirmation.
HOW TO TRADE
You should put the entry order just above the neckline. Because when the price breaks the neckline (resistance), it clearly indicates that the bulls are in control. Place the stop loss just below the right shoulder. You should add the height of the head with the level of neckline to provide a price target to the upside.
BULLISH EXPANDING TRIANGLE
DEFINITION
It is a broadening formation with rising volatility having a bullish sentiment. It is very rare in real market conditions and it can be either reversal or continuation pattern depending on the specific market condition when it is formed. condition when it is formed.
This pattern is a bullish reversal chart pattern if it forms at the end of a downtrend. Then it represents a potential trend reversal and you can expect an uptrend.
But it will be a continuation pattern if you identify it in an uptrend. Then it just simply a continuation of the trend.
ALSO READ: Bull Expanding Triangle
HOW TO RECOGNIZE
Bullish Expanding Triangle pattern develops in 3 Phases:
1. Background (Prior trend):
There always a prior trend Before occurring a chart pattern.
It can be forms either after an downtrend or in a up trend.
2. Consolidation of Price:
The price of the security trade in a narrow zone as the pattern appears and price continues to make higher highs and lower lows making the trading range broader.
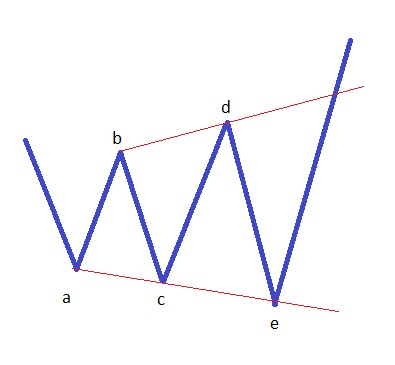
3. Break out of the upper resistance line:
As pattern develops the trading range broader and indicates the fight between bears and bulls. When price breaks the upper resistance line it indicates the win of bulls.
FEATURES AND LIMITATION
- Vary in their duration. Can found in any time frames. But they are generally quite large.
- These patterns generally contain two swing highs and two lows.
- As the pattern develops the volume decline.
- It can be identified easily characterized by a series of higher highs and lower lows.
- The upper resistance line is sloping upward and the lower support line is slopping downward.
- As the pattern develops the trading zone expands.
- When the pattern starts the volatility is very low and price trades in a narrow zone and as the pattern develops the trading zone expands.
HOW TO TRADE
When price breaks the upper resistance line price tends to advance. So, enter the market with a buy order (long position).
Place your buy order just above the breakout of the upper resistance line. More defensive traders wait for a candle to close above the upper resistance line for confirmation. Whereas more aggressive traders place their orders when the price trade above the upper resistance line.
Place your stop loss tight and place it just below your entry.
Though there is no confirmed method to estimate your profit target in bullish expanding chart patter, but for rough calculation expand the height of expanding part of the triangle upward from your entry point.
These are some most popular reversal chart pattern forms quiet often in the market. There are many more reversal pattern.
ALSO READ: