
Indicator can be applied with securities past patterns, volume, or even other indicators. However, they are most relevant for short term price movement.
They are an integral part of technical analysis. Indicators can be divided broadly divided into two types—-
TOPICS TO COVER
- MACD (Moving Average Convergence Divergence)
- Parabolic SAR
- Relative Strength Index (RSI)
- Average Directional Index (ADX)
- Stochastic Oscillator
- On Balance Volume
- Bollinger Band
- Leading indicators
- Lagging Indicators
- Trend Indicator
- Momentum Indicator
- Volume Indicator
- Volatility Indicator
- CAUTION
MOVING AVERAGE CONVERGENCE DIVERGENCE
DEFINITION
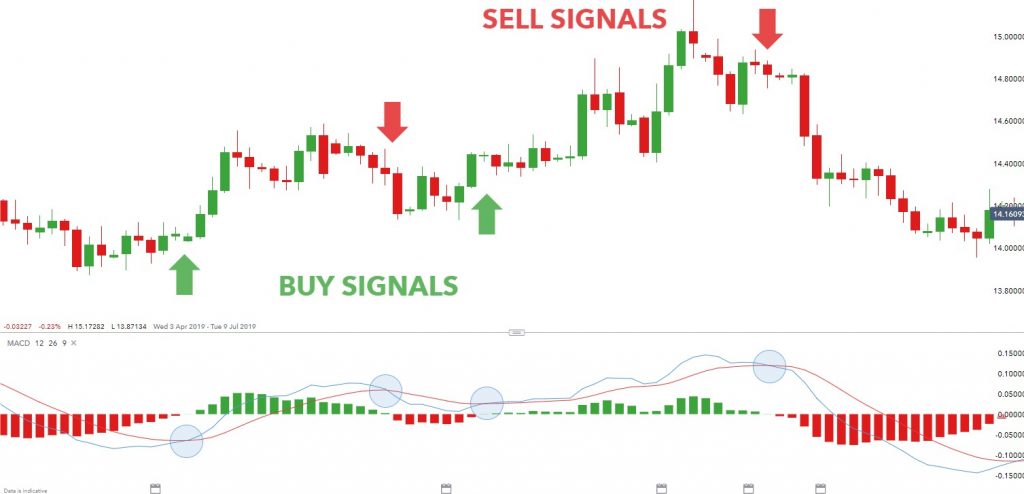
It is formed by 2 lines. One line is formed by 26 period moving average line divided by 12 period moving average line. Another line is calculated by a simple 9 period moving average.
STRUCTURE
I) Consists of two line.
ii) Fluctuate around middle 0 line.
Iii) It is not range bound.
iv) Fast line is the moving average of the difference between the 12-period and 26-period moving averages.
v) The slow line is 9 period simple moving average.
ALSO READ: What Is Moving Average Convergence Divergence – MACD?
TRADE SIGNAL
i) When MACD line crosses the simple moving average line and go up, it indicate buy signal.
ii) When the MACD line goes below the single moving average line, then indicate sell signal.
iii) Divergence between the price trend and moving average line represents sell signal.
iv) Likewise, the crossing (converge)of two MACD line indicates a formation o a new trend.
v) When it crosses the zero line top-down it indicate down trend.
vi) Similarly, if it crosses zero line bottom-up it represents uptrend.
PARABOLIC SAR INDICATOR
DEFINITION
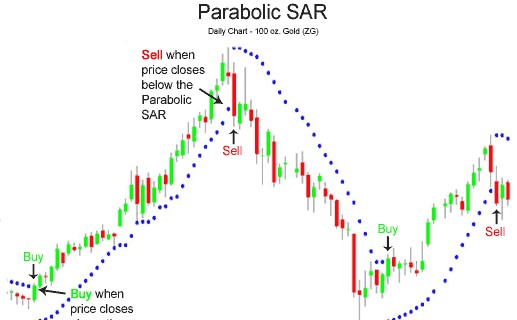
It is used to determine the direction of the future price of a security. This indicator draws on the price action chart above or below the price trading zone.
STRUCTURE
I) Graphically shown as series of dots on the chart pattern.
ii) In a uptrend dots are placed below the price .
iii) Similarly, in a downtrend dots are placed above the price.
TRADING SIGNAL
i) When dots are placed below the price it generate buy signal.
ii) When dots are placed above the price it signal bearish sentiment and generate a sell signal.
iii) do not use Parabolic Stop and Reverse (Parabolic SAR) in a ranging market because there is a lot of noise. So the dots continue to flip from upside to downside giving you no clear signal.
RELATIVE STRENGTH INDEX (RSI)
DEFINITION
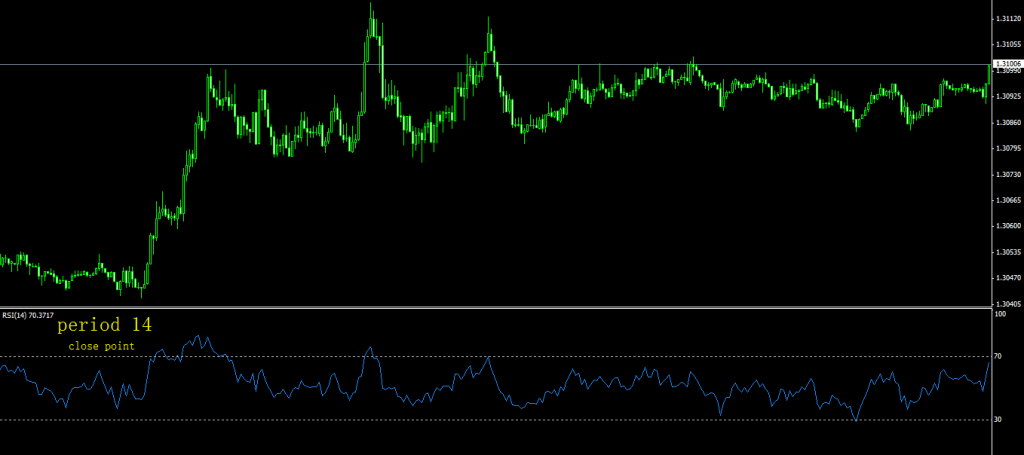
RSI is calculated by plotting recent gains in price vs. recent loss in price. So, RSI represents the momentum as well as the strength of the trend. This indicator is a range-bound indicator and moves between 0-100.
CHARACTERISTICS
1. The most basic use of RSI indicator is identify overbought and oversold market.
2. RSI indicator formed with a single line fluctuate between the range of 0-100.
3. However, the 70 and 30 line act as a potential resistance and support line respectively.
4. There is also a middle 50 line in RSI indicator.
TRADING SIGNAL
1. Reading over 70 mark indicate overbought market.
2. When the single RSI line goes below the 30 mark it represents over sold market.
3. Single RSI line also can be used to confirm trend formation. Reading over the middle 50 lines indicate the market in an uptrend. Similarly, RSI reading below 50 line indicate the market is in a downtrend.
4. Divergence between RSI reading and Price action readings indicate the current trend losing the strength. Therefore, a potential trend can reverse.
AVERAGE DIRECTIONAL INDEX (ADX)
DEFINITION
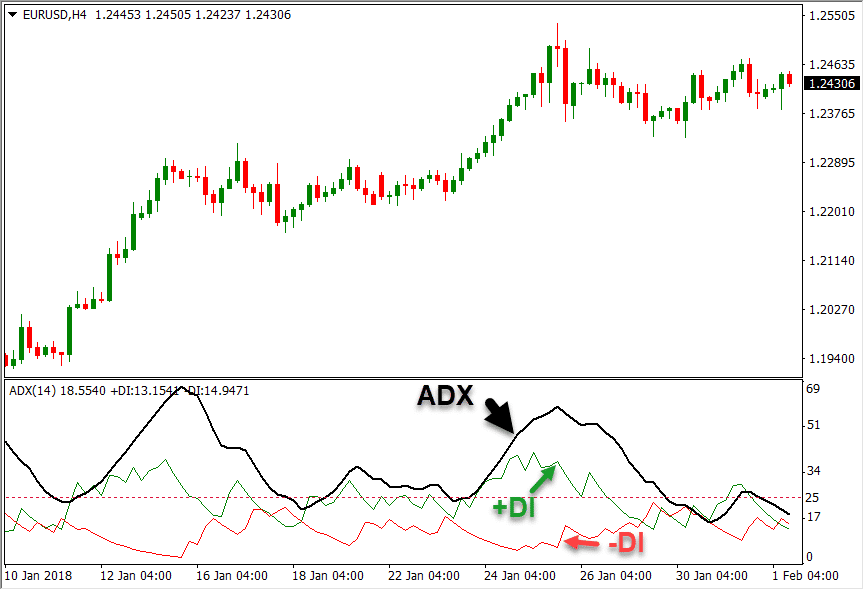
It is a trend indicators. Thus it is used to identify how strong the current trend is and momentum of the indicator.
STRUCTURE
ADX indicator is formed by three lines — Most importantly the ADX line (black), +DI line (green), and -DI line(red).
CHARACTERISTICS
i) ADX value range from 0-100.
ii) It is a trend indicator.
iii) Reading above 40 indicates that the strength of the trend is strong (upward or downward). Similarly, value below 20 represents the current trend is a weak trend, and reversal may occur or non-trending.
iv) Moreover, it is a oscillator indicator.
v) In addition, it has no middle line.
TRADE SIGNAL
i) ADX line above 40 and +DI line above -DI line: Strong uptrend.
ii) Likewise, ADX line above 40 and -DI line above +DI line: Strong downtrend.
iii) However, ADX below 20, +DI and -DI line crossing each other: Ranging market and weak trend, no trend at all.
CAUTIONS
i) Avoid it with other trend indicators to avoid false breakout.
i) The default parameters of the indicator may not suits with your own trading technique. So, customize them as your requirement.
STOCHASTIC OSCILLATOR INDICATOR
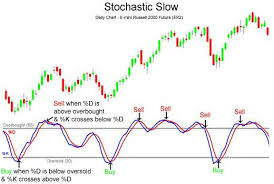
DEFINITION
It is a trend indicator. Stochastic is used to predict where the trend might go. It measures the current price of a security relative to the price range over a number of periods.
The basic idea behind stochastic is when the trend is an uptrend the price tends to makes new highs. Likewise, when the trend is a downtrend the price tends to make new lows.
Thus, stochastic continue to move up and down as price rarely makes new highs and lows. So, stochastics don’t remain in the higher or lower level for a long period of time.
STRUCTURE
i) It is also a range bound indicator and are plotted between 0-100.
ii) It is a oscillator indicator.
iii) It is made up of two lines. One line is faster than other.
CHARACTERISTICS
i) The 80 mark indicate potential overbought.
ii) Similarly the 20 mark (line) indicate potential oversold signal.
iii) Value over 80 in a uptrend is less significant (as it is expected).
iv) Likewise, value below 20 in a down trend is less significant.
TRADING SIGNAL
i) When above 80— over bought signal.
Below 20— Over sold signal.
ii) When the fast line crosses the slow line bottom-up at (or near) the 20 level, it indicates buy signal. And vice versa.
Iii) Divergence between price action and stochastics represents a weakening of the current trend and potential trend reversal.
ON BALANCE VOLUME
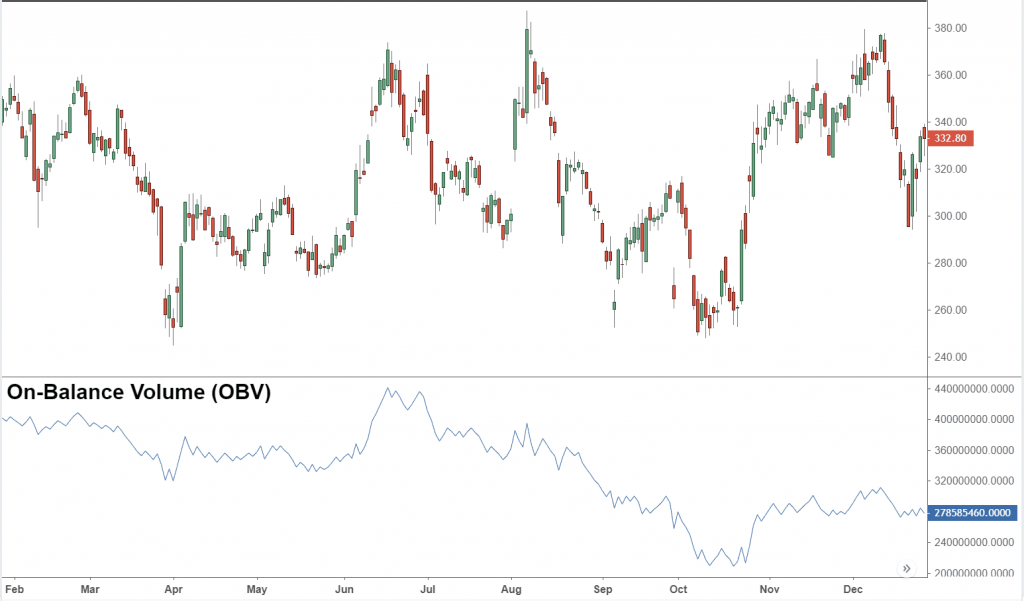
DEFINITION
This indicator is running a total of the volume in an uptrend and volume in a downtrend in a time frame. In short, this indicator measures the positive and negative volume flow.
STRUCTURE
I) OBV is a leading indicator and produces lots of false signals.
Ii) It is formed with only one line.
iii) Further more, it in not a range bound indicator.
CHARACTERISTICS
i) It is a volume indicator.
ii) OBV rising means bullish sentiment, in short bullish volume surpasses the bearish volume.
iii) OBV falling means bearish sentiment, in short bearish volume surpasses the bullish volume.
TRADING SIGNAL
Can be acts as a trend confirmation tools.
i) When price and OBV rising, it indicates a strong buy signal (as the rising price strongly backed by buyers—OBV increase means buying volume increase).
ii) When price and OBV falling, it indicates a strong sell signal (as the falling price strongly backed by sellers—OBV falling means selling volume increase).
iii) Divergence between OBV and price indicates the weakening of the trend. If price rice but OBV falls means the price rise is not strongly backed by buyers and reversal may occur soon.
BOLLINGER BAND
DEFINITION
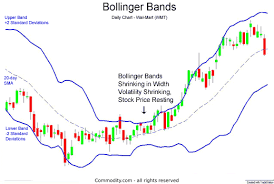
Bollinger band creates a price band around the current market price. The current market price’s relation with the price band helps to determine what to do next.
STRUCTURE
I) It consists of three-line—-moving average as the middle line, upper standard deviation line, and lower standard deviation line. The outer lines make the band.
ii) In addition, it is plotted directly on the price action chart around the price fluctuation.
CHARACTERISTICS
I) The upper standard deviation line acts as a dynamic resistance line. Whereas the lower standard deviation line acts as a dynamic support line.
ii) It is a volatility indicator.
TRADING SIGNAL
Can be used in both ranging and trading market.
i) In a ranging market look for Bollinger Bounce ( price tends to bounce from one side to another side, always returning to the middle moving average line). If the price hits the top of the bandit signal sell order and if the price hits the lower band it indicates buy signal.
ii) In trending market look for Bollinger Squeeze, which helps you to place your entry order because after a squeeze breakout can happen in either direction.
Leading indicator
They precede the price action. Therefore they performed best and used most accurately in a range-bound market. Thus generate most false signals.
Ex. Oscillators, RSI.
Lagging Indicator
The technical indicators that trails the price action. Therefore, they perform best and used most efficiently in the trending market. It generates comparatively low false signals.
Ex. Moving Average.
Trend Indicator
They indicate the direction of the trend. If there is a direction of the price movement at all. These instruments are mostly trend following indicators.
Ex. Moving Average; MACD; Parabolic SAR etc.
ALSO READ: Leading, Lagging, and Coincident Indicators
Momentum Indicator
This type of indicator tells you how quickly market-moving? How strong the trend is? If any kind of trend reversal is going to happen.
Ex. Relative Strength Index (RSI), Average Directional Index (ADX), Stochastic oscillators.
Volume Indicator
Volume indicators tell you how the volume of the security is changing over time. It is very relevant because, when price changes the volume indicates how strong the price action is.
Ex. On Balance Volume.
ALSO READ: Different Types of Trading Indicators: Trend, Momentum, Volatility and Volume
Volatility Indicator
Volatility Indicators tells that how much the price is changing in a given time period. So, the faster the time changes the greater the volatility.
Ex. Bollinger Band.
CAUTION
1. Add more than five indicators in your toolbox but focus on only two or three indicators and learn them inside out.
2. Never choose indicators that generate the same signal. Always choose indicators that complement each other.
3. Practice and confirm different indicators and choose which suited best for you.
4. Learn about indicators and try to understand why you should choose one indicator instead of another.
In conclusion, indicators are helpful to identify the right trading opportunity to maximize profit and minimize loss.
ALSO READ: